Investment and the Current Account
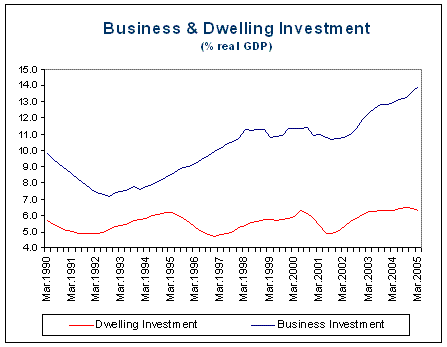
There has been scepticism in comments about my claim that Australia has experienced a non-dwelling investment boom and that this is the main driver of the deterioration in the current account balance. The following chart shows the dwelling and private business investment share of GDP, although leaves out some investment components such as public investment. Total investment has been at record levels as a share of GDP, yet the dwelling investment share has remained relatively stable.

posted on 08 June 2005 by skirchner
in Economics
(8) Comments | Permalink | Main
|

Comments
Again, note that this is all in volumes - the expenditure figures show the opposite pattern.
If you want to use hedonically adjusted volume numbers for computers, you need to focus on net rather than gross investment, and depreciate the stock of computers at an annual rate of at least 30 per cent. That would wipe out most or all of the measured increase I imagine.
Posted by quiggin on 06/08 at 12:10 PM
Stephen can you post a chart using the expenditure figures? As John says, it will show the opposite pattern.
Posted by .(JavaScript must be enabled to view this email address) on 06/08 at 01:11 PM
How can you look at net investment rather than gross to analyse the trade figures is beyond me?
1.What Quiggin is saying is that we need to depreciate a cost that has already occurred: computers in his example and then compare that to the raw undepreciated component on the other side dwellings. The real fallacy of this logic is that he tries to compare housing to a computer. You can’t compare them. That’s why we need to look at gross numbers as the chart does to see what is going on.
2. Another fallacy is to ignore the purchase as a historical event by trying to bring depreciation into the picture and then applying present value (to one side only and narrowly-computers0.
In effect he wants to bring depreciation forward for computers but leave it alone for housing . Really? And when buys a house does one immediately look at it and think it will depreciate 5% in 12 months time?
More importantly, depreciation is simply a book entry. It is not a sinking fund. Businesses recognize the depreciation of computers etc. but the underlying reality is that equipment will be replaced when it needs relacing and whether a firm can afford to replace it.
Posted by .(JavaScript must be enabled to view this email address) on 06/08 at 01:17 PM
I’m no economist, so can someone please explain to me why the “chain volume measures” (columns C and E) and “current prices” (columns N and P) tell two completely different stories in the spreadsheet below?
http://www.rba.gov.au/Statistics/Bulletin/G11hist.xls
I have a hard time reconciling Stephen’s view (that we have seen a boom in non-dwelling investments) with what I see when I walk around the real world. i.e. New apartments everywhere!
Perhaps the miners have been buying lots of machinery which has been invisible to the rest of us, but have businesses really spent up on equipment to anything like the degree that property developers have spent over the past 5 years? Common sense tells me otherwise.
Posted by .(JavaScript must be enabled to view this email address) on 06/08 at 02:55 PM
The recent deterioration in the current account deficit is being driven by volumes, not prices. I think the nominal/real and net/gross issues depend on exactly what questions you are trying to answer. I’m not saying the price story is completely irrelevant, but that the real story is the one we should care about.
Incidentally, if you make allowance for the notional amount the ABS deducts from household saving for depreciation of the housing stock, then the household saving ratio is still positive.
Posted by skirchner on 06/08 at 03:22 PM
David, dwelling investment is obviously more apparent to the naked eye, so I don’t think casual observation is going to help give an accurate impression! Now that you have the data, you can make a better judgement. It is good to see someone take an interest in what the data are actually saying. We will make an economist out of you yet!
Posted by skirchner on 06/08 at 03:45 PM
Well, if the price story is not completely irrelevant lets see the chart! We’re only seeing half the story.
Can you please explain to us amateur economists why it less important than the “chain volume measures”
I have no agendas to push, no ideaologies to follow, just trying to understand if all this money Australia borrowed was spent on something productive, or thousands of empty apartment buildings.
Posted by .(JavaScript must be enabled to view this email address) on 06/08 at 04:40 PM
Posted by davidm on 06/08 at 04:55 AM
Who are you going to believe - a gifted economist sifting through the econometric tea leaves or your own lyin’ eyes?
Posted by Jack Strocchi on 06/09 at 11:13 AM